This office used a third of its electricity (33%) while the building was closed. Leaving aside what always has to run, that closed-hours use costs about £2,800 a year at 25p/kWh, and almost half of it happens on Saturdays.
The headline figures
| Measure | Value | What it means |
|---|---|---|
| Electricity a year | 79,191 kWh | Scaled up from 363 days of valid readings (99.5% coverage) |
| Energy cost a year | £19,798 | At a flat rate of 25p/kWh, before standing and capacity charges |
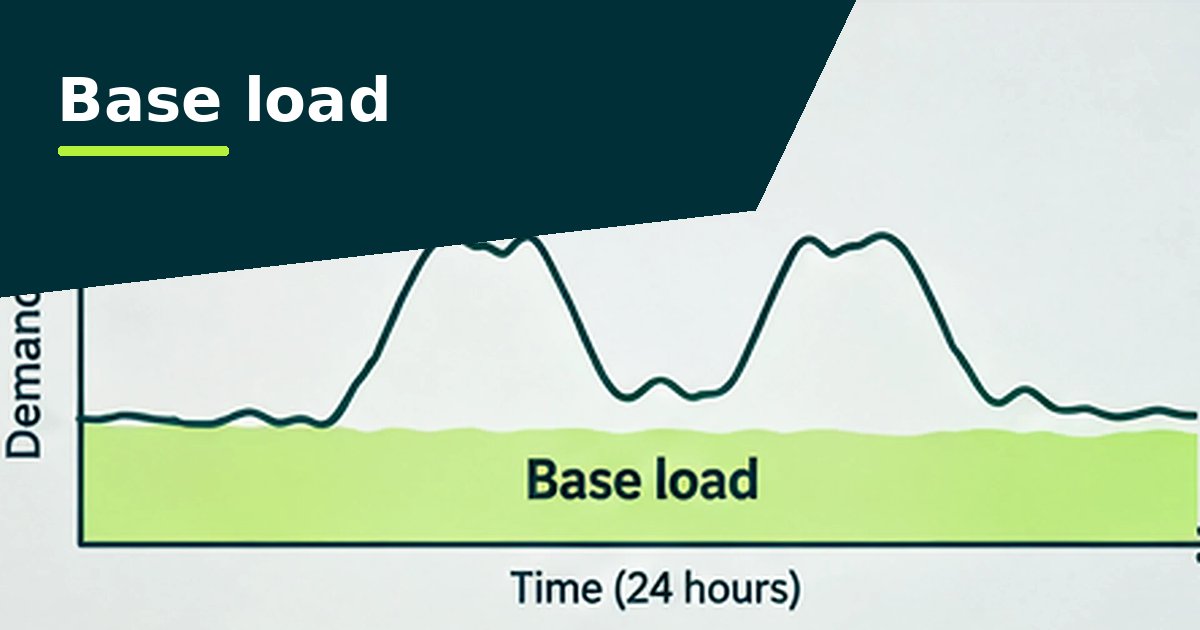
| Base load | 2.6 kW | The level demand rarely drops below |
| Busiest half hour | 25.5 kW | 28 January 2025, midday |
| Use while closed | 33% | Using the default office hours, 07:00 to 19:00 on weekdays |
| Closed-hours excess | £2,776 | Electricity used while closed, above the base load, at 25p/kWh |
Where the electricity goes
The analyser splits each half hour's use at the base load. The three parts add up to the total:
- Base load, 29% (22,606 kWh). What runs around the clock, whether anyone is in or not.
- Use above base load while open, 57% (45,062 kWh). The building in normal use: lights, heating, computers and kitchens during the working day.
- Closed-hours excess, 14% (11,035 kWh). Use above base load while the building should be closed. This is the place to start, because it usually costs little to fix.
What the analyser found
1. Use while closed: £2,776 a year (high impact)
Breaking this down by type of day is the most useful step, because each type usually has a different cause:
| When | Above base load |
|---|---|
| Saturdays | 5,155 kWh |
| Weekday evenings and nights | 3,750 kWh |
| Bank holidays | 1,408 kWh |
| Sundays | 722 kWh |
Saturdays account for almost half. Sundays are quiet, so this isn't heating or ventilation running all weekend. The building is being used on some Saturdays. If that's planned, add Saturdays to the calendar and the figure falls. If it isn't, a Saturday booking or a few staff may be running the whole building.
2. Seven bank holidays look like working days (medium impact)
On seven bank holidays, including Christmas Day and Boxing Day, the office used at least 80% of a normal weekday's electricity. If the office was closed, the heating and ventilation schedules probably don't include bank holidays, which is very common. If it was open, the calendar needs updating.
3. Early starts and late finishes: £629 a year (low impact)
Demand rises before opening and stays high after closing. That's about 1,250 kWh a year above base load in the two hours before opening, and the same again in the two hours after closing. Timers and heating start-up settings are the usual cause, and they're quick to adjust.
Supply capacity
Assuming an agreed supply capacity of 40 kVA and a power factor of 0.95, the busiest half hour reaches 27 kVA, which is 67% of capacity. Keeping a 10% safety margin, the site could take about 9 kW of extra constant load. That's enough for modest EV charging, such as one 7 kW charger, but nowhere near enough for a heat pump to heat the whole building. See supply capacity and kVA.
What we'd do next
- Confirm the opening hours, including Saturdays. Every closed-hours figure depends on them.
- Check the heating and ventilation schedules for bank holidays and start times.
- Walk round the building on a Saturday to see what's switched on and who is using it.
- Look at the base load. 2.6 kW running all year is about 22,800 kWh, roughly £5,700 at 25p/kWh. See how to reduce it.
57% of this office's electricity is used during the working day, which is when solar panels generate. Our UK Solar Calculator estimates what a roof system would save, and the solar page shows how to size one from this data.
Questions people ask
Is this real data?
No. We made up the office and its readings so we could show the method without using anyone's real data. Every figure is what the analyser reports for the example file.
How long does an analysis like this take?
Loading a year of data takes about a minute. Confirming the opening hours and reading the findings takes longer, and matters more.
Are these figures savings?
No. They're what each pattern costs now at 25p/kWh. Any saving depends on what you change.