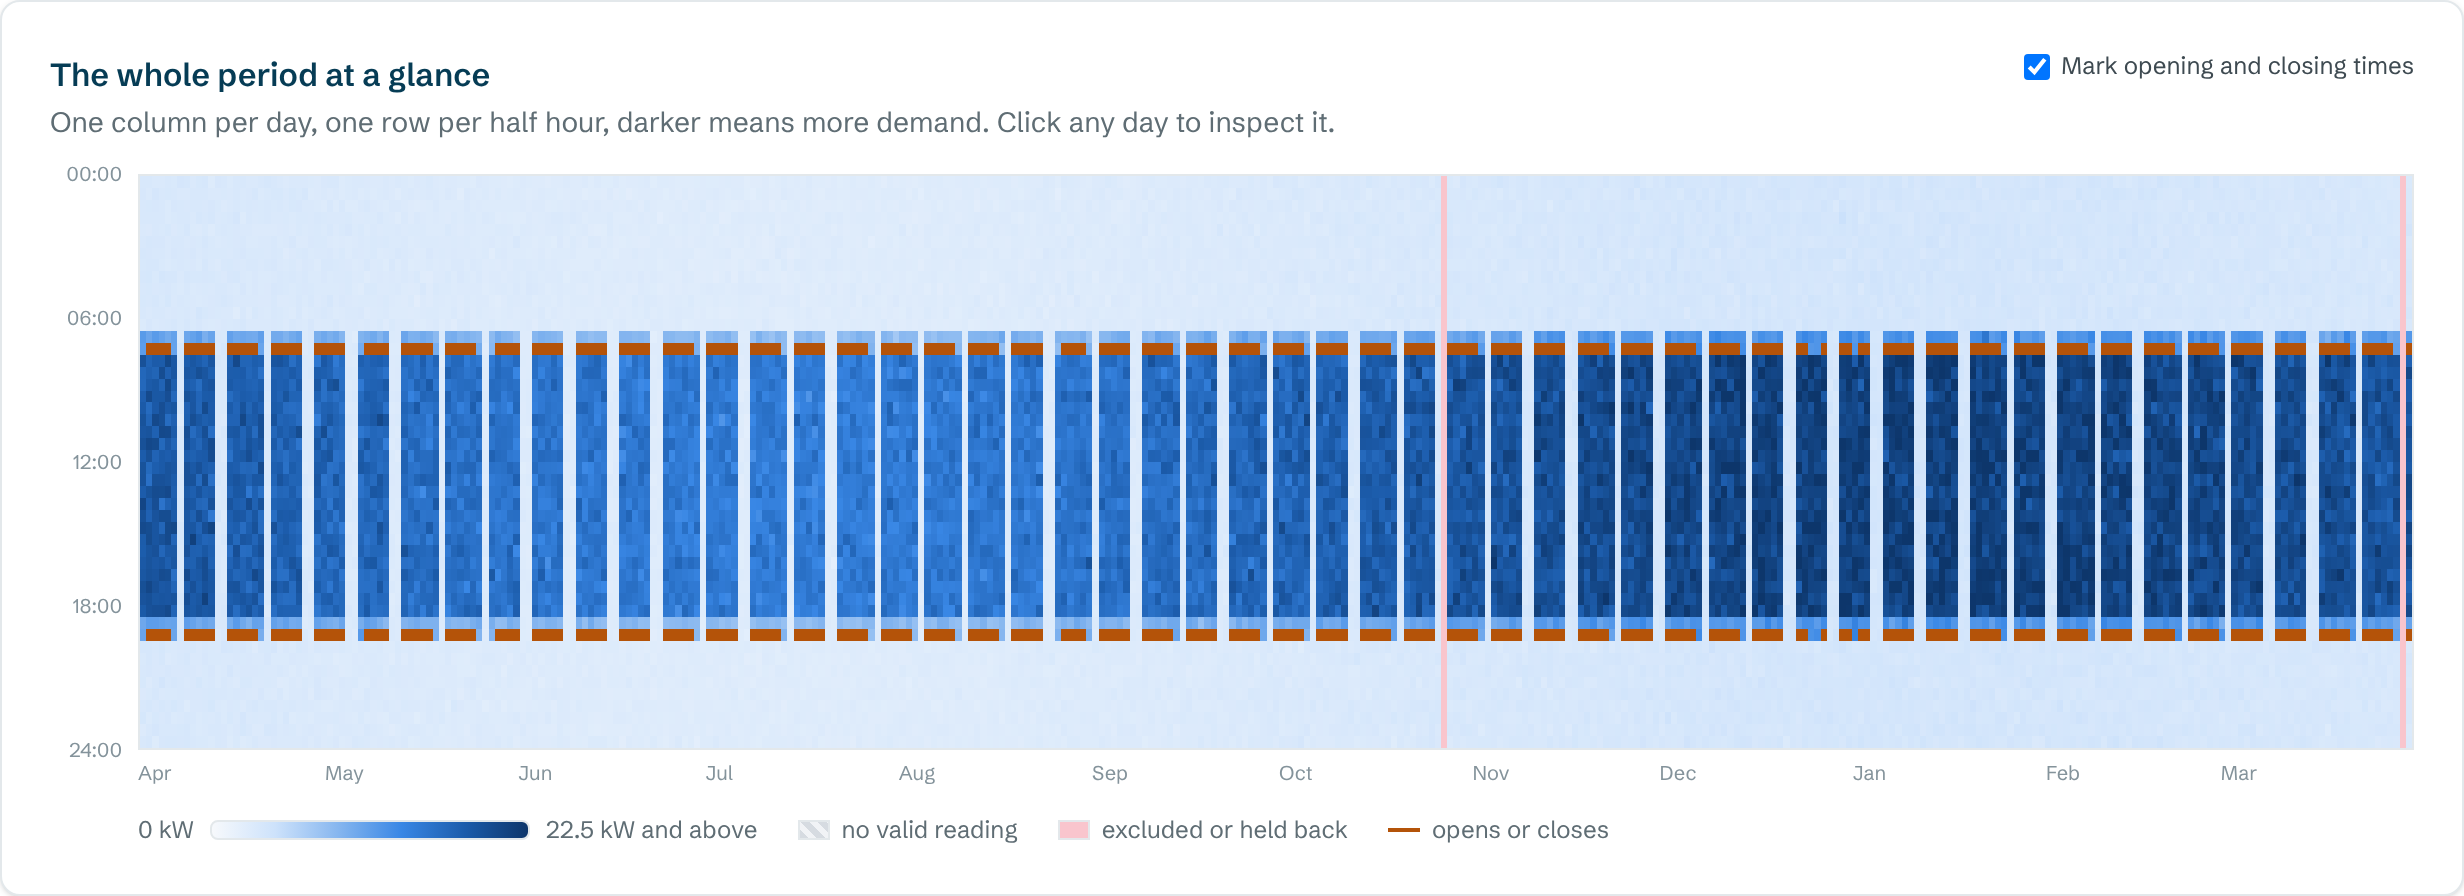
A half-hourly heatmap has one column for each day and one row for each half hour, with darker colours for higher demand. Normal use shows as a dark band during opening hours. Anything dark outside that band, such as at night, at weekends or in holidays, is worth checking.
What you're looking at
- Across: days, from the start of the period to the end.
- Down: time of day, from midnight at the top to midnight at the bottom.
- Colour: demand in that half hour, from pale (low) to dark (high).
A year contains about 17,500 half hours. That's far too many numbers to read in a table, but the heatmap shows them all at once, which is why it's often the quickest way to understand a building.
What normal looks like
For a building used on weekdays, you'd expect a dark horizontal band during working hours, regular pale gaps at weekends, and pale nights. Winter is often slightly darker than summer. The edges of the band show when the building actually starts and stops using electricity each day, which isn't always when the doors open and close.
Patterns worth checking
| What you see | What it usually means |
|---|---|
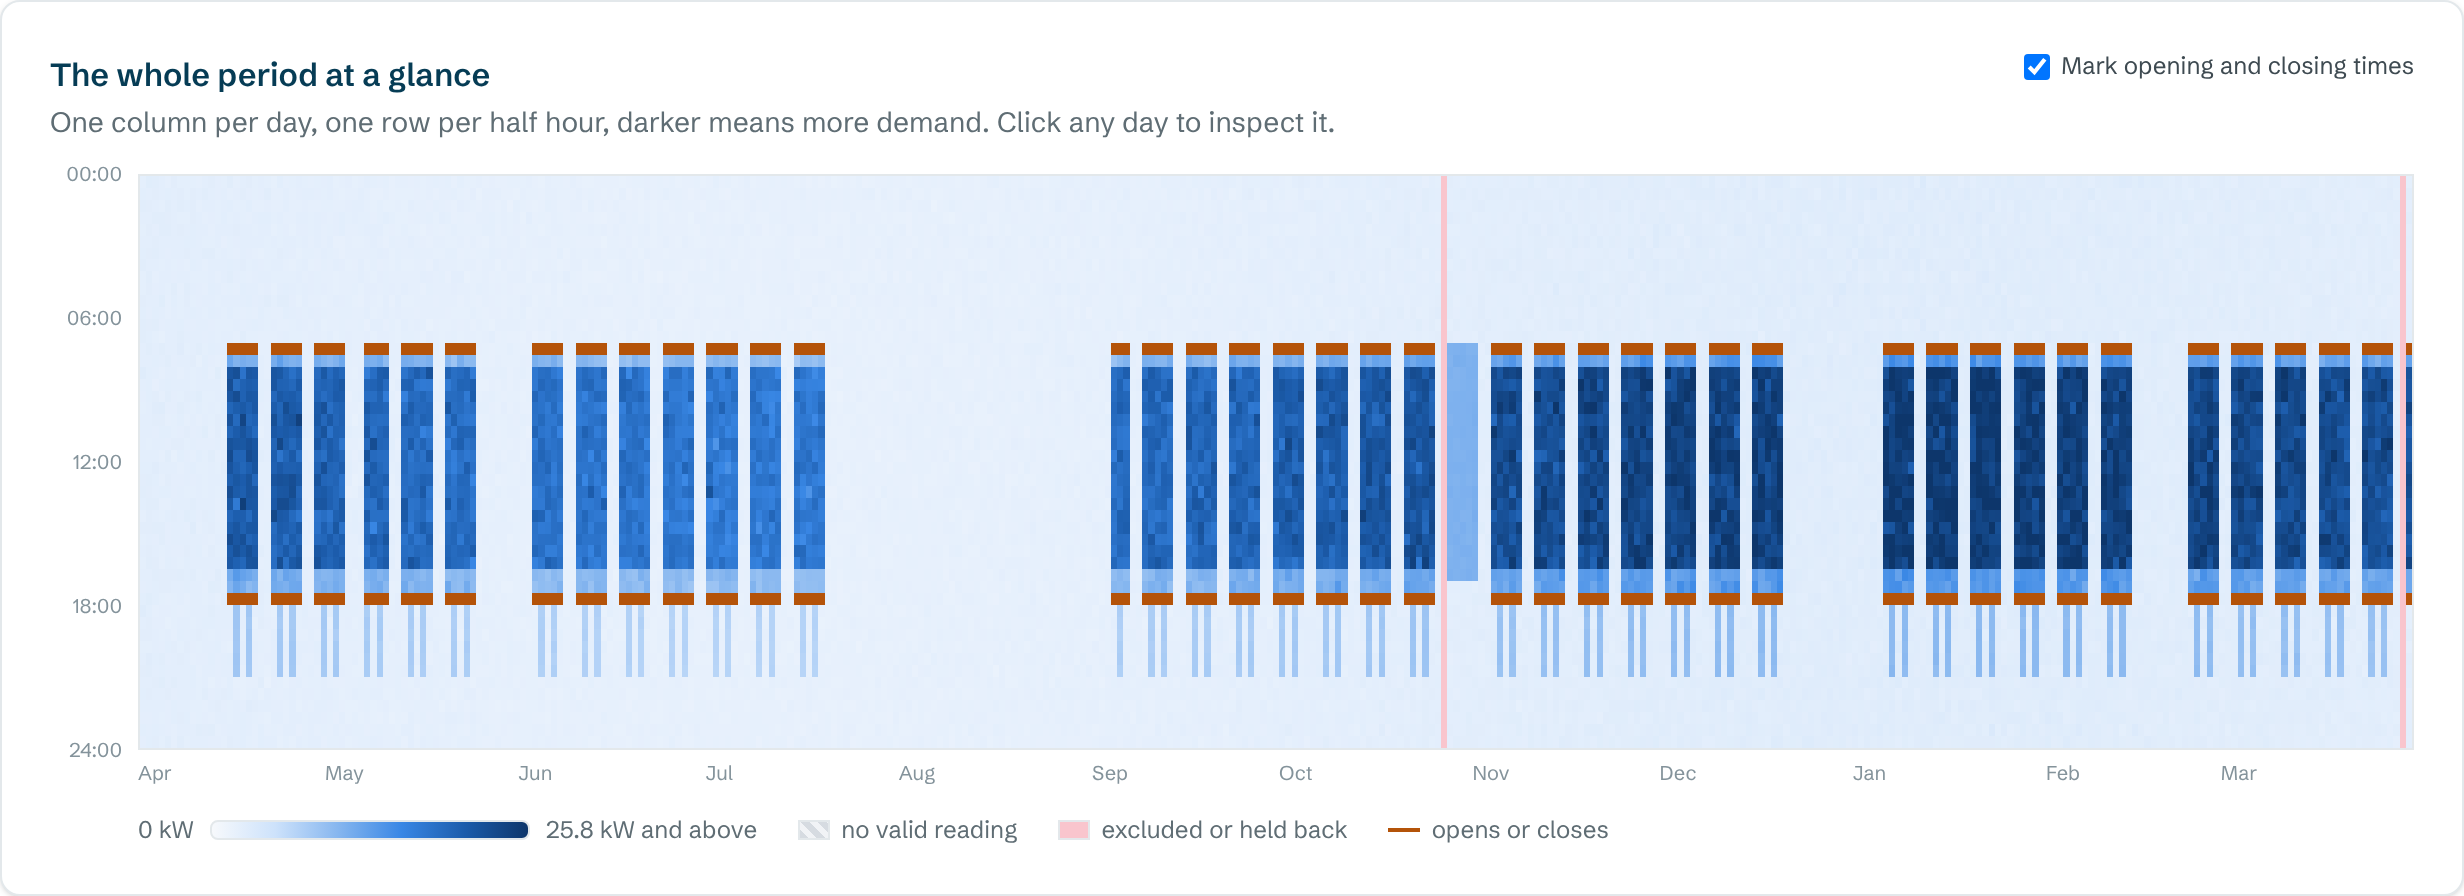
| A pale block where it should be blank, such as a holiday week | Heating or ventilation running to the normal schedule with nobody in |
| Thin stripes in the evening on the same weekdays | Regular evening use, such as lettings, classes or cleaning |
| The dark band starting well before opening | Heating or ventilation set to start too early |
| Nights that get darker from a certain date | New equipment, or something left on, has raised the base load |
| A single dark column | One unusual day, such as an event, a fault or a reading error |
| Grey or striped gaps | Missing data (not zero use) |
Putting a cost on what you see
The heatmap shows you where to look, and the figures tell you how much it matters. In the analyser, click any day to compare its half hours with a typical day. Then use the out-of-hours and unusual-day findings to put a cost on what you've spotted.
Questions people ask
What is a carpet plot?
Another name for the same chart: one column per day and one row per half hour, coloured by demand.
Why are some days grey?
They have no valid readings. Missing data is shown as missing rather than as zero, so gaps don't look as if the building was switched off.
Can I see one day in detail?
Yes. In the analyser, click any day on the heatmap to compare its half hours with a typical day of the same kind.