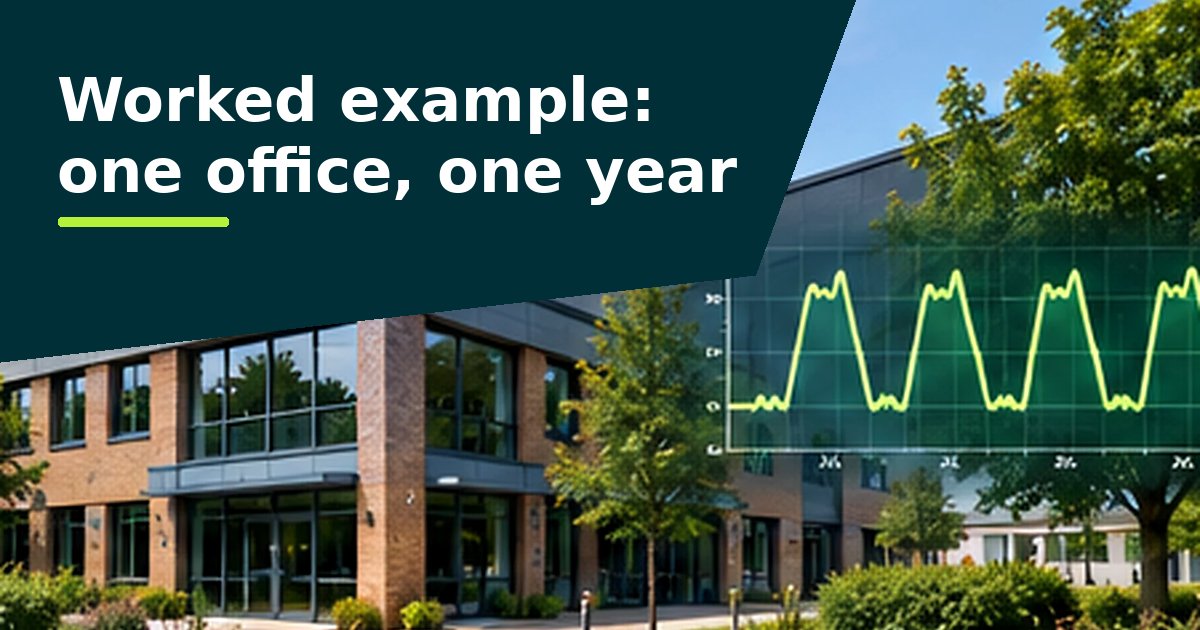
The analyser checks every half-hourly reading, works out how much electricity the site uses when it's open and when it's closed, and prices the difference at your rates. It tells you where to look. Someone who knows the building then decides what to change.

1. Reading your files
Load one file for each meter, as Excel (.xlsx or .xls) or CSV. Three layouts work:
- Day per row: a date, then 48 half-hourly readings. This is the most common supplier format.
- Day per column: the same, turned on its side.
- Timestamped: one reading per row, with its date and time.
The analyser shows how it read each file: which column held the dates, whether readings were in kWh or kW, and anything it ignored. If a file covers more than a year, the last 12 months are analysed by default. You can choose a different period, and long-term trends still use the whole file.
2. Checking the data
Before showing any figures, the analyser looks for problems that would make them wrong:
- missing readings, which are left out rather than counted as zero
- days of zero readings, which usually point to a meter or data fault
- days when the clocks change, and duplicate rows, which it holds back for you to decide on
- single readings far above the usual peak
Each site is rated Good, Check or Poor. You can exclude readings you know are wrong and record why, and the reason is saved with the analysis.
3. Opening hours
The figures for use while closed depend on knowing when each building should be open. Every site starts with standard office hours, marked as unconfirmed until you check them. You can set hours for all sites at once or one at a time, including closures, bank holidays and overnight shifts. Findings based on unconfirmed hours get a lower confidence rating.
4. Base load and use while closed
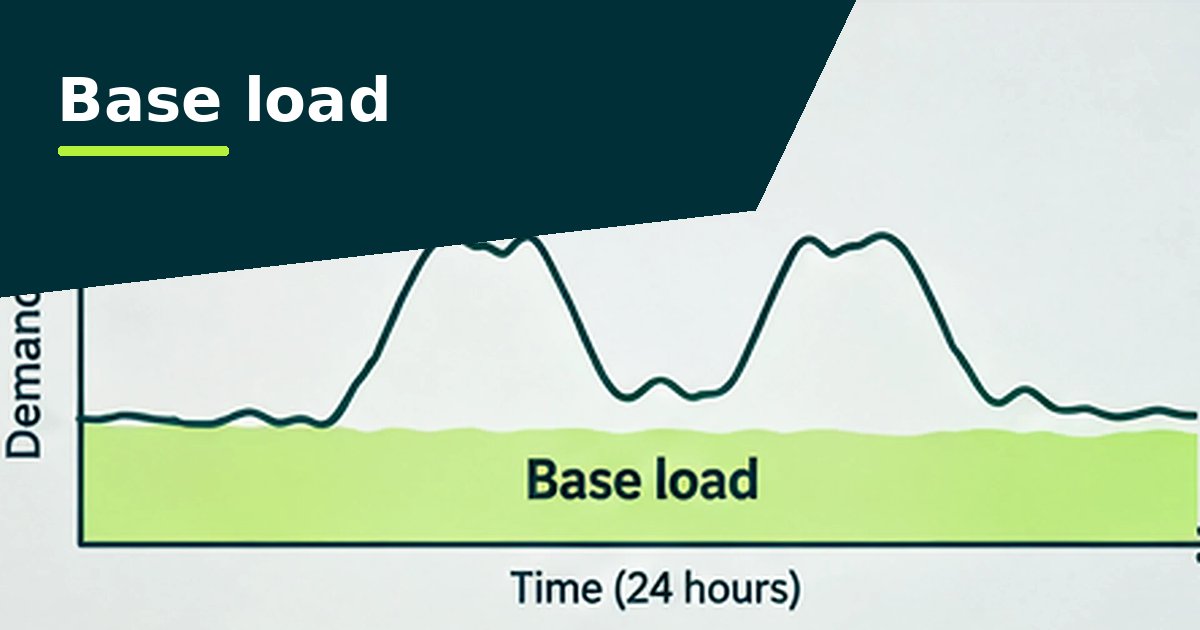
Base load is the level of demand a site rarely drops below. The analyser measures it as the 5th percentile of all valid half-hourly readings, which means demand is higher than this 95% of the time. It's the equipment that never switches off, such as servers, fridges and anything on standby.
Closed-hours excess is the electricity used while the site is closed, over and above the base load. Sites are ranked by this figure because it's often the cheapest use to reduce, usually by changing timers, controls and building management settings rather than buying new equipment.
5. Costs and annual figures
Costs use the unit rates you enter, either one flat rate or different rates for different times of day. They leave out standing charges, capacity charges and other fixed costs. They show what a pattern costs you now and are not a promise of savings.
Annual figures are scaled up from the valid readings. With less than about 11 months of good data they're marked as indicative, and with less than six months they aren't shown.
6. Findings
Each finding has two separate ratings. Impact shows how much it matters, based on cost and share of total use. Confidence shows how reliable the evidence is, based on data quality and whether the opening hours are confirmed. A finding with high impact and low confidence is worth checking before you quote it.
7. Capacity and headroom
Enter your agreed supply capacity (in kVA, from your bill or connection agreement) and an assumed power factor. The analyser compares every half hour with it and works out how much extra constant load the site could take before reaching the limit. Treat this as an early check, because only your network operator can confirm it.
What it can't tell you
- Data from the main meter shows when electricity is used, but not which equipment is using it. Findings are things to check on site.
- Figures are not adjusted for weather or changes in occupancy.
- Carbon figures use a single conversion factor for the year, which you enter.