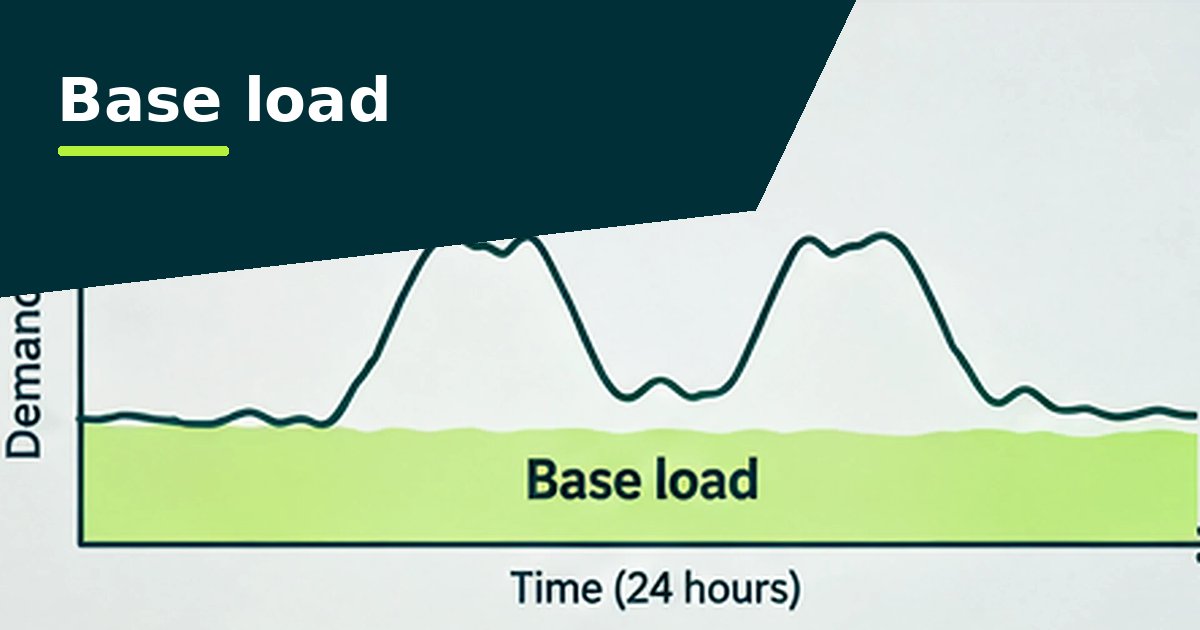
Demand follows the shift pattern, stepping up when a shift starts and down when it ends. During planned shutdowns, use should fall close to the base load.

What to check first
- Compressed air left on overnight and at weekends (leaks show as a steady load once production stops)
- Refrigeration and chillers working harder than they need to
- Shutdown weeks where use never gets close to the base load
- Lighting in high-bay warehouses left on outside shift times
- Peaks compared with capacity, before adding EV charging for vans or forklifts
Setting the opening hours
Enter shift times, including night shifts, and planned shutdowns, so the analysis can separate production from everything else.
Use these as a starting point. Each site is compared with its own calendar, so getting the hours right matters more than the type of building.
How does your building compare?
To see whether a site's total use is high for its type, compare its kWh per square metre with the government survey ranges in our electricity benchmarks by sector. Then use the half-hourly pattern to find out why. Questions about the analyser itself are answered in the FAQ.
Thinking about solar panels? The analyser's Capacity tab shows how much of a system's output a building like this would use itself, and the UK Solar Calculator works out the cost and payback. See sizing solar from half-hourly data.
Questions people ask
How do I spot compressed air leaks?
Look at demand after production has stopped. If the compressors keep running with nothing using air, the steady load is often leaks.
Can the analyser handle night shifts?
Yes. Opening hours can run past midnight, and each day of the week can have different hours.