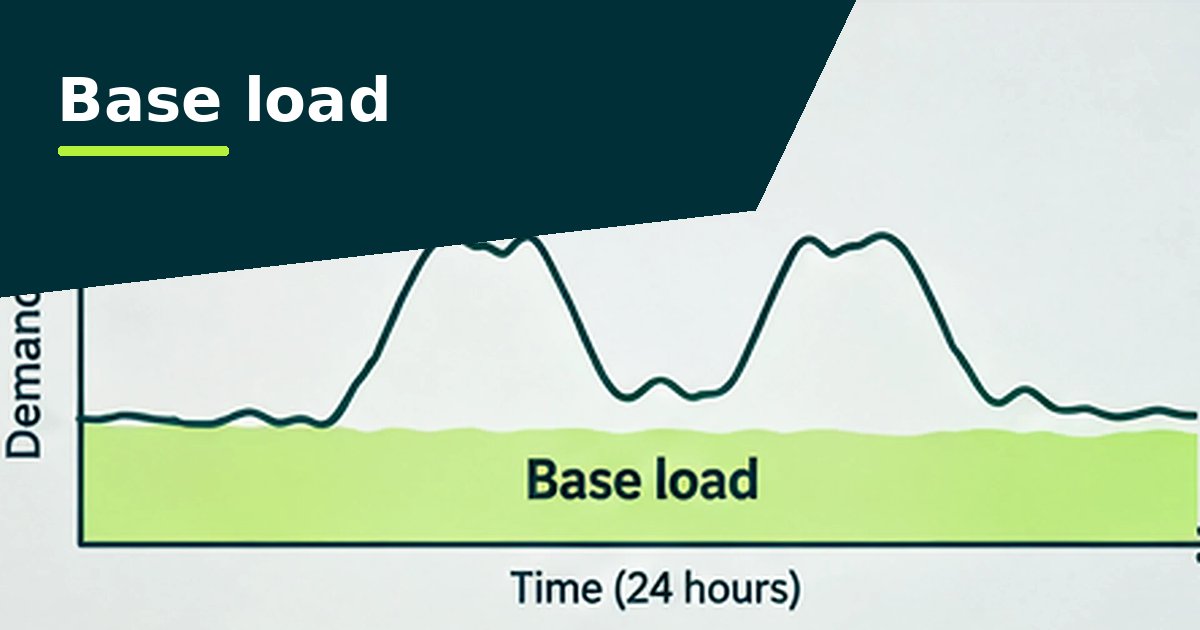
Compare a period before the change with a matching period after it. Use the same days of the week, the same types of day (open, closed, holiday) and enough weeks to even out day-to-day variation. Then look at the part of demand the change should affect, such as base load or out-of-hours use, rather than the total bill.

Compare like with like
- Compare the same types of day. Compare weekdays with weekdays and holidays with holidays. A before period with several bank holidays in it will make the after period look better or worse than it really is.
- Use enough data. Four to eight weeks either side is usually enough to show a real change. A single week can be thrown off by one unusual day.
- Keep the periods close together. The closer they are, the less the weather and the seasons get in the way.
- Leave out the change itself. Skip the days when the work was being carried out.
Measure the right thing
Choose the measure the change should affect:
| Change | Look at |
|---|---|
| Heating or ventilation schedules | Out-of-hours use, and demand around opening and closing |
| Switching off equipment overnight | Base load |
| LED lighting | Demand during opening hours |
| Holiday settings in the building controls | Use during closures |
Total consumption mixes the effect of your change with everything else that happened, such as changes in occupancy, the weather or new equipment. A genuine saving can get lost in it, and so can a change that didn't work.
Weather and seasons
Electric heating and cooling depend on the weather. If the period before the change was colder than the period after, some of the drop is down to the weather. For heating changes, compare the same weeks a year apart as a cross-check, or adjust for weather using degree days if you have them.
In the analyser
- Did a change make a difference? on the Base load tab compares matched weeks either side of a date you choose.
- Compare periods on the Heatmap tab shows any two periods side by side.
- Persistent changes on the Unusual days tab flags lasting shifts automatically, so you can check whether a change shows up when you'd expect.
If you need a formal measurement and verification of savings, for example for a funded project or an energy performance contract, the International Performance Measurement and Verification Protocol (IPMVP) sets out recognised methods.
Questions people ask
How long should I wait before checking?
Four to eight weeks of data after the change, compared with the same length of time before it, is usually enough to see a real change.
Why has our bill not gone down?
A saving in one place can be hidden by changes elsewhere, such as occupancy, weather, prices or new equipment. Compare the specific measure the change should affect.
Can this replace a formal M&V report?
It's a good check, but formal measurement and verification (for example under IPMVP) agrees the baseline, adjustments and reporting up front.