With its term dates entered, this school used 31% of its electricity while closed. That's about £1,260 a year above what always runs, at 25p/kWh. The biggest single issue was October half term, when the empty building used more than twice what it should have.
Setting it up
The analyser never assumes school holidays, because they vary between schools and from year to year. You enter them. For this school:
- Building type: School (open 07:00 to 17:30 on weekdays)
- Six closures: Easter, May half term, summer, October half term, Christmas and February half term
- Hours marked as confirmed
Without the term dates, holiday weeks would be treated as normal school days, and heating left on during a holiday would look like normal use.
The headline figures
| Measure | Value |
|---|---|
| Electricity a year | 57,753 kWh |
| Energy cost a year (25p/kWh) | £14,438 |
| Base load | 1.9 kW |
| Busiest half hour | 30.1 kW |
| Use while closed | 31% |
| Closed-hours excess | £1,261 a year |
The year at a glance
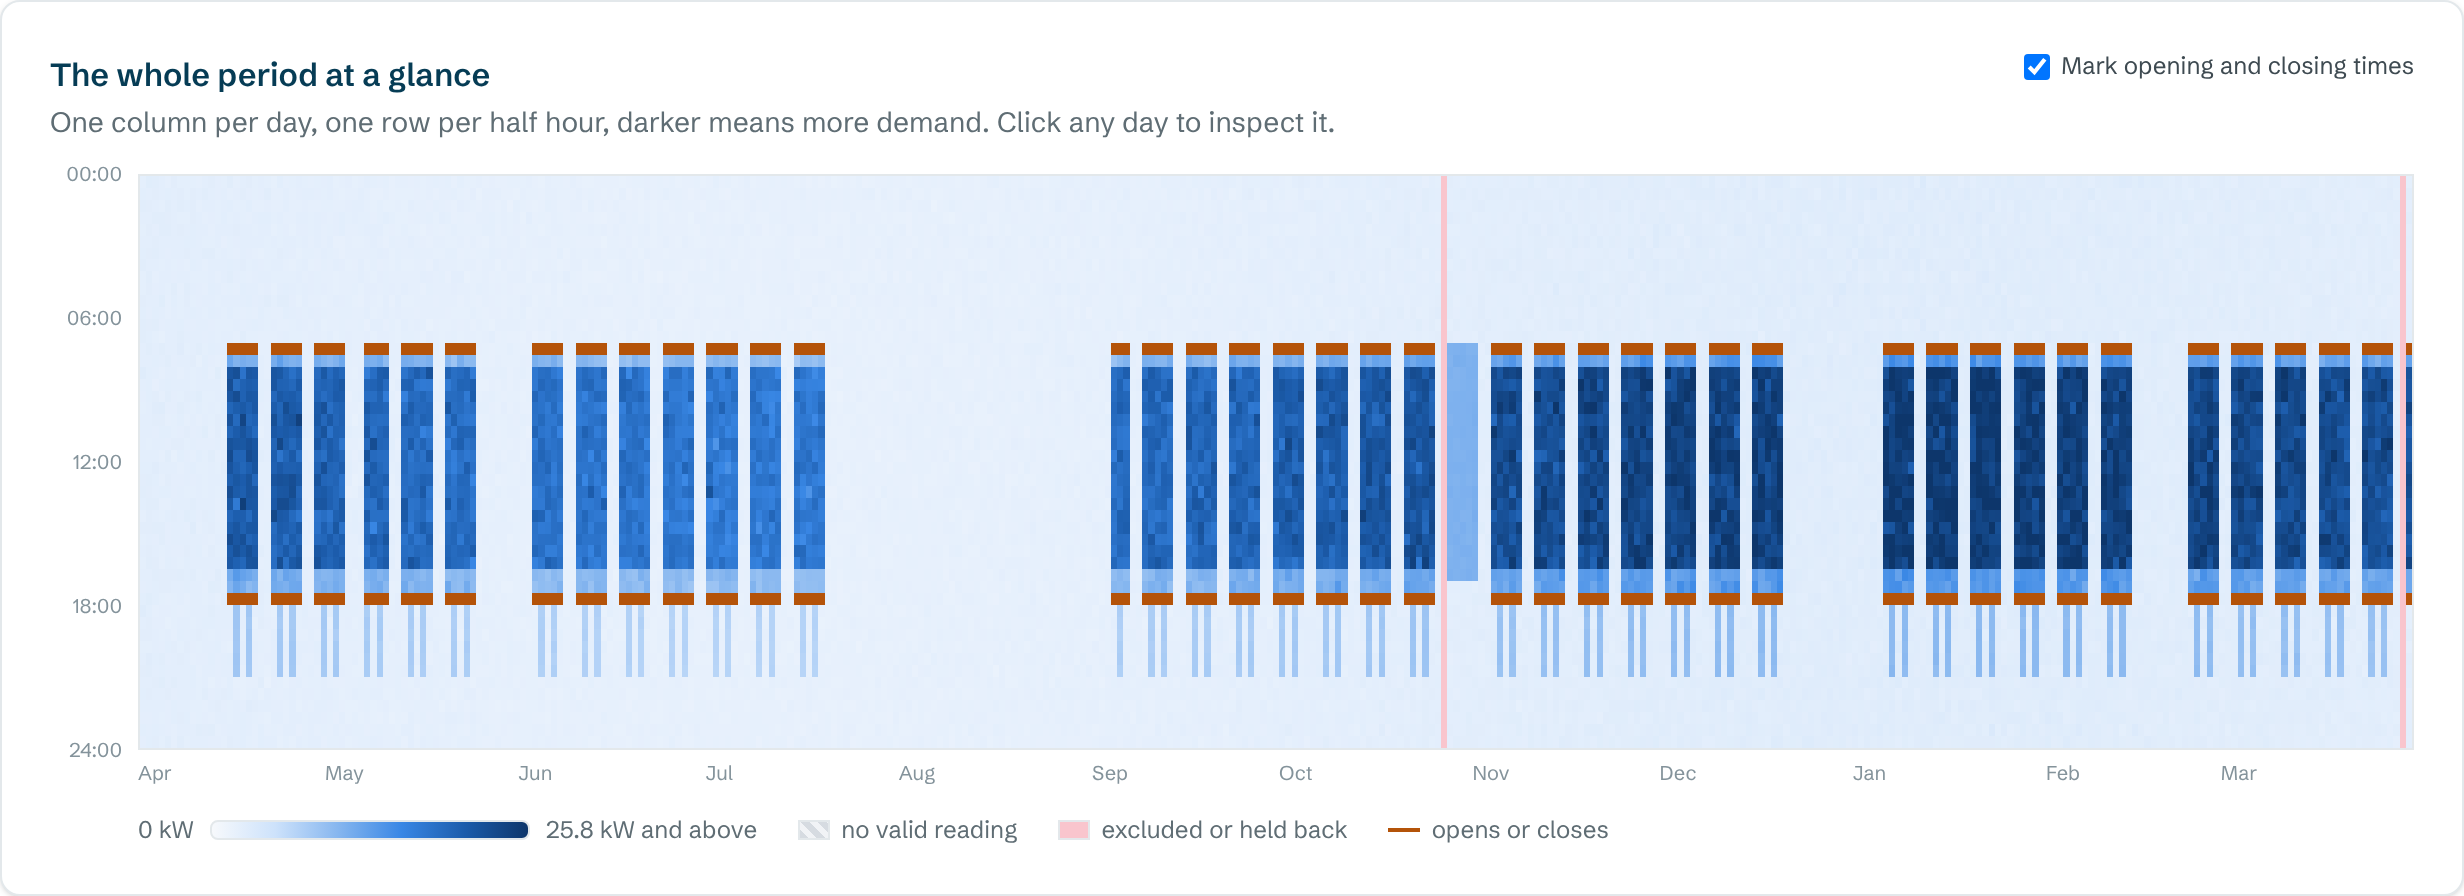
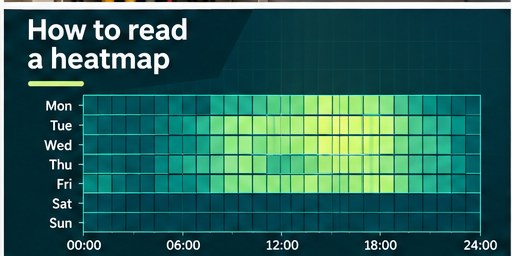
Two things stand out: a pale block across all of October half term, and thin stripes after 18:00 on two evenings a week during term. See how to read a heatmap.
What the analyser found
1. Heating left on through October half term
The three days with the most out-of-hours use all fell in half term, each about 100 kWh above base load. The analyser flagged a lasting change: from 25 October, demand was at least 15% above its expected level on five of nine days, and on average more than double. The pattern (07:00 to 17:00 on weekdays, with nobody in) suggests the heating and ventilation stayed on their term-time schedule. It's a common problem in schools: the building controls know about the long holidays but not the half terms.
2. Evening lettings
Weekday evenings make up the largest share of the closed-hours excess, at 2,765 kWh above base load. The stripes on Tuesday and Thursday evenings are a regular hall letting. Lettings are fine, and often bring in useful income, but they should be entered in the calendar as open hours. It's also worth checking whether a hall booking is lighting and heating more of the building than it needs.
3. Holidays and weekends
The holidays added 1,157 kWh above base load, most of it in October. Saturdays and Sundays were close to base load (556 kWh and 526 kWh above it over the year), which is what you'd expect.
What we'd do next
- Add the full holiday calendar to the building management system, so heating and ventilation switch off for half terms as well as the long holidays.
- Add the lettings to the analyser's calendar, then check what the hall booking switches on.
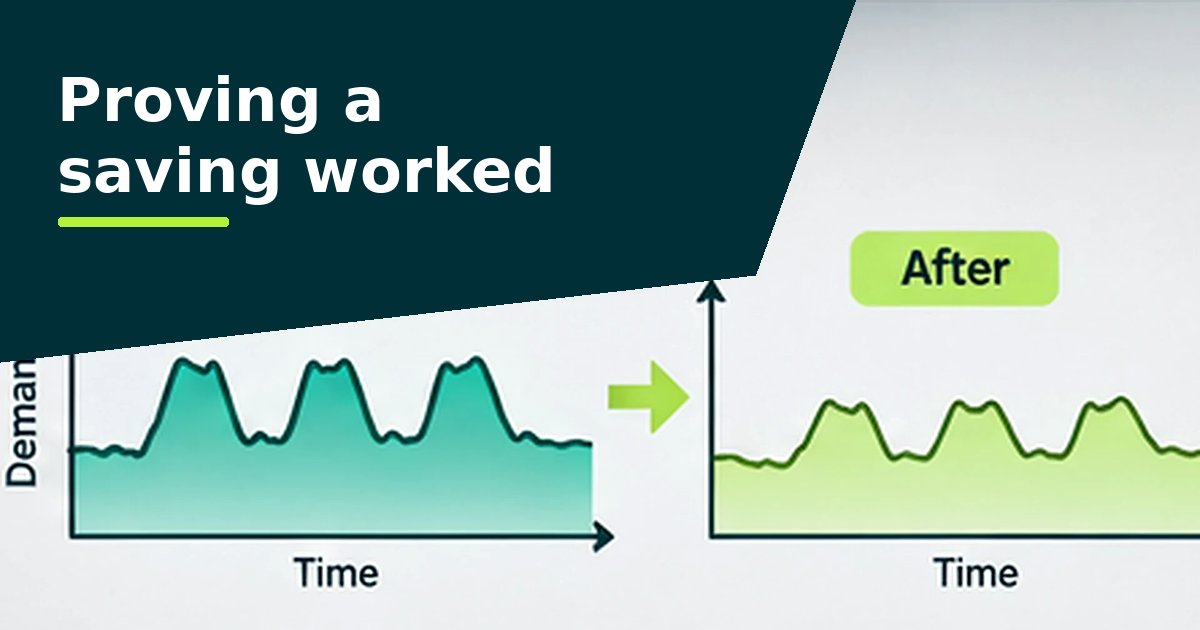
- Check the next half term using the analyser's before-and-after comparison, to see whether the fix worked.
Questions people ask
Do I have to enter term dates?
Yes. The analyser never assumes them, because they vary between schools and from year to year. Enter them as closures. Without them, holiday weeks count as normal school days.
Should a school use nothing in the holidays?
No. The base load carries on (IT, fridges, security). Holiday use above the base load is what to look at.
Is this real data?
No. We made up the school and its readings so we could show the method without using anyone's real data.